Regulatory Genetic network AND DSPN

Q:
I am studying your publication in Science (Comprehensive functional genomic resource and integrative model for the human brain, Science 362,1266(2018) with great interest. As a quantitative geneticist, I found it very relevant to the study of complex genetic traits. Therefore, I am writing this note to request your assistance inorder get your software/algorithm for Regulatory Genetic Network modeling and Integrative deep learning model (DSPN) so that we could implement them at NIH supercomputer system and conduct some integrative genomic modeling work in the area of brain/neuropsychiatry.

A:
Best to see resource.psychencode.org. Specifically — you can find the matlab codes "7. Matlab code and formatted data for
the DSPN" on http://resource.psychencode.org/

PsychENCODE GRN questions

Q1:
I had a few questions about the Gene Regulatory Networks published as part of the Comprehensive functional genomic resource and integrative model for the human brain at http://resource.psychencode.org/. Could you pass these along to whomever is best suited to address them?

First question: Which reference genome is used?

The GRN has the following format:

Transcription_Factor,Target_Gene,Enhancer_Region,Edge_Weight

And most rows look like:

BARHL2,SHC1,chr1:154869072-154870071,0.284806116416629

however, some rows just have "Promoter" in the Enhancer_Region column, like this one:

NR2F2,SHC1,Promoter,0.120934147846037

But since NR2F2 (and most other genes) have a couple different reference haplotypes in both refseq and gencode (e.g. see NR2F2 in UCSC genome browser), it’s ambiguous to me where "Promoter" designates.

Does there exist a version of the GRN with Promoter substituted for chromosomal coordinates, or would you mind sending a reference to the haplotype you used as reference when building this GRN?

To summarize above: what reference genome did you use in constructing the GRN? What region does "Promoter" evaluate to?

A1:
We defined the promoter regions by a window of ±1.25 kb (=2.5 kb in
total) relative to the transcription start site (TSS) on hg19.

Q2:
Could you send the hg19 reference genome you’re referring to?

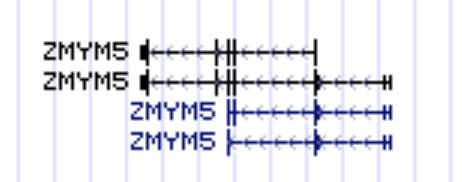
If I go to the UCSC browser and look at refseq hg19, for some arbitrary gene: [[see image]]

The gene has multiple reference isoforms. Where does your GRN situate the promoter for this gene? i.e. which chromosomal location does the ChIP track you integrated in your GRN identify the TF at? Chromosomal coordinates would be less ambiguous than stating the TF binds the promoter. Would the production of such a network be possible, or would you be able to send us a reference genome you used with a single location for each promoter (i.e. a single tss)? How did you choose the ‘canonical’ isoform for each gene? What about the promoters upstream of the other tss’s — is there evidence of regulation at those alternate promoters?

Any chance you might be able to resolve this for us? It seems to limit the utility of this network to have this ambiguity about the chromosomal location of these transcriptional regulatory events. It would be a shame not to resolve it, I think.

A2:
I have added the promoter TSS file to our website at: http://resource.psychencode.org/Datasets/Integrative/tss.sites.codingOnly.gencode.v19.annotation.bed

It can be found at resource.psychencode.org by navigating to the section on "Integrative Analysis", and scrolling to item 3.

Loregic – further validation

Q:
I’ve been trying to apply the Loregic algorithm in other organisms in order to further validate the method, however I’m finding some inconsistencies that could be related to data manipulation (choosing datasets, merging and mean-centering samples).
Furthermore, I’ve also found those inconsistencies when trying to reproduce the analysis from yeast datasets provided in your publication (probably due to the same data manipulation issues described before).

Would you be able to provide a more in-depth protocol for using Loregic with multiple datasets (how you handled the data, for example) in order to improve the consistency of the method between labs?

A:
Yes, we normalized the yeast data. Here was how we preprocessed:

1) got time-series yeast cell cycle data (alpha, cdc15, cdc28) from
http://genome-www.stanford.edu/cellcycle/data/rawdata/combined.txt,
which were logarithm values.
2) standardized(2^(data)) s.t., each time point has mean=0, and sigma=1
3) binarized the standardized data using the function,
binarizeTimeSeries with ‘kmeans’ clustering in R package BoolNet.

Loregic paper: binarized yeast expression data

Q:
I am writing to ask if you could kindly share with me the yeast cell cycle binarized expression data that you used in Loregic’s paper.

In our group we would like to find a method to identify the logic rules that govern cooperativity of multiple regulators, in GRNs built from differentially expressed genes.

The amount of samples we will have is limited, so we will be mainly relying on literature information, and as a first step we would like to test our method on your binarized expression data.

A:
We used BoolNet to binarize data,
http://cran.r-project.org/web/packages/BoolNet/index.html . We also
tried ArrayBin,
http://cran.r-project.org/web/packages/ArrayBin/index.html, which gave
very similar Loregic results with BoolNet (see Supplemental Figure).

The yeast cell cycle data we used was the classical microarray data
published in 1998 (Spellman & Cho):
http://genome-www.stanford.edu/cellcycle/data/rawdata/

Bulk Tissue Deconv. Cell Fractions

Q:
I would like to apply the bulk-tissue deconvolution algorithm in your recent paper (Wang et al., 2018) using our own single cell RNA-Seq data and Gandal et al., 2018’s bulk tissue RNA-Seq. I couldn’t find code related to the deconvolution steps in the Gernsetin Lab github page (https://github.com/gersteinlab/PsychENCODE-DSPN) or on the PsychEncode resources page. I only found results to the cell fraction calculations. Would you be able to point me towards how I can apply this algorithm?

A:
We used non-negative least square method for deconvolution and implemented it using R function nnls (https://www.rdocumentation.org/packages/lsei/versions/1.2-0/topics/nnls) For example nnls(C, bi) estimates the cell fractions for ith tissue sample, where C is cell type gene expression matrix (row: gene, column: cell type), and bi is the gene expression vector for ith tissue sample.