Q:
I am reading your paper “Supervised enhancer prediction with epigenetic pattern recognition and targeted validation”, and I would greatly appreciate if you could provide some results apparently missing in Figure 2.
I am interested in the AUPR comparison of the matched-filter results with the peak-calling results, but I could not find the "gray" numbers.
Fig. 2 a, ….the gray numbers in the parentheses refer to the performance of the peak-based models.
A:
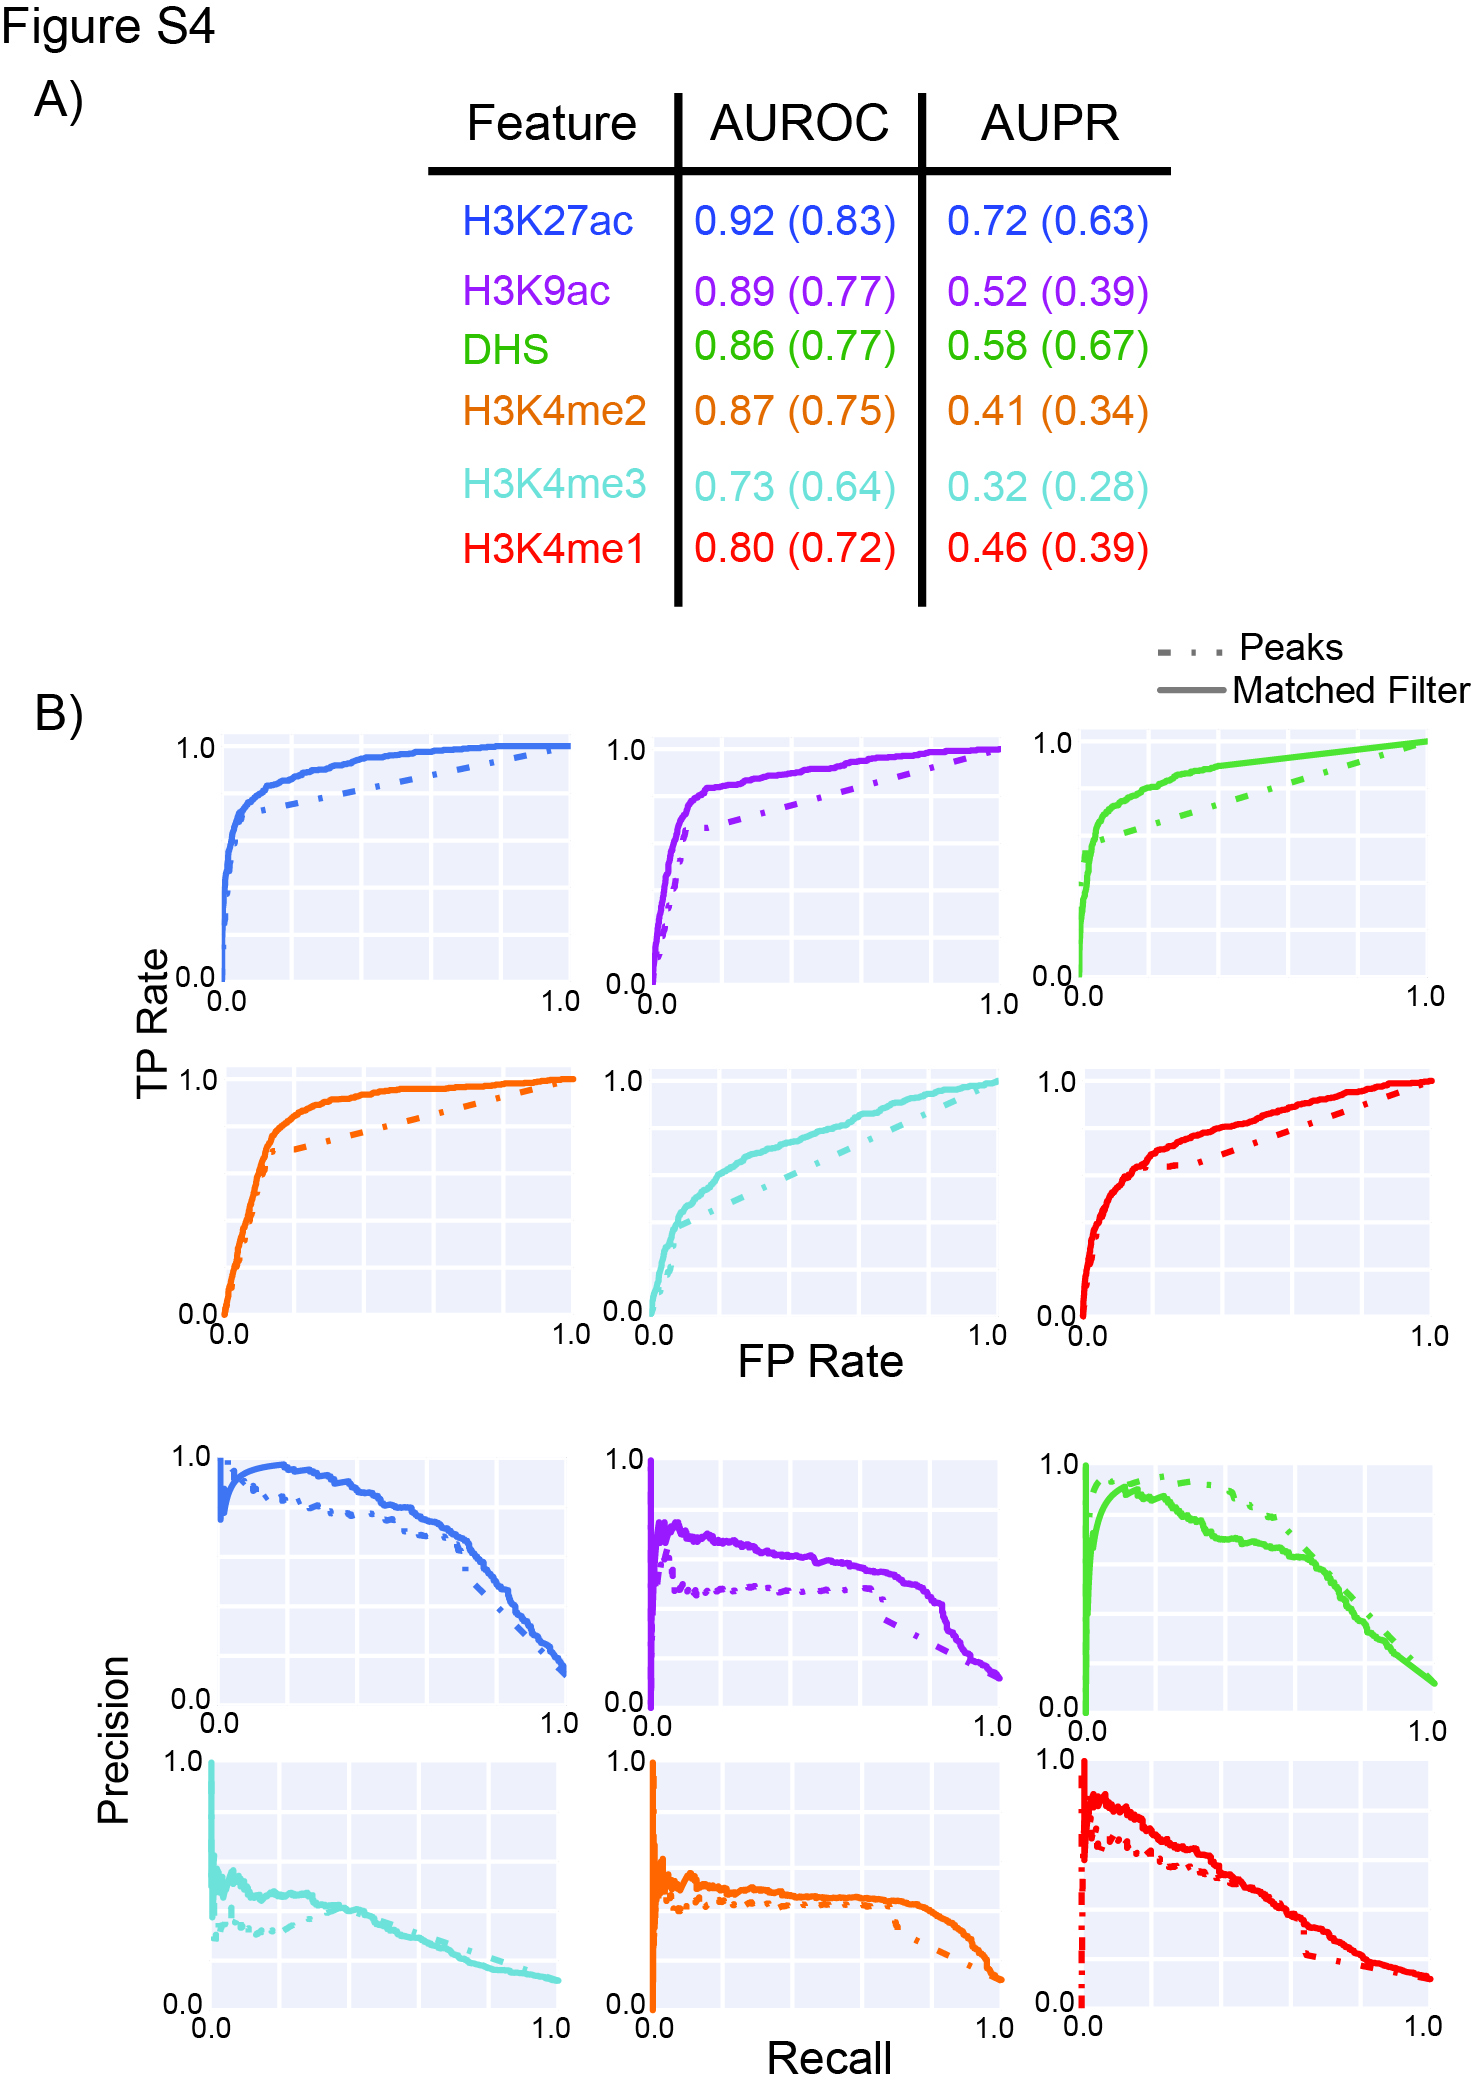
Thank you for bringing this to our attention and apologies for any confusion. We lost the numbers during one of the revisions. I am attaching a SI figure from an older version of the manuscript that answers your question.
In the table, I have compared the AUROC and AUPR for accuracy of different matched filter models (outside parentheses) with the corresponding peak based accuracy measures (within parentheses) for same histone marks. In this particular case, the comparison is made based on overlap with a single STARR-seq experiment but the trends remain the same even after combining information from multiple STARR-seq experiments within the same cell-line.